December 12, 2024
In this post, I demonstrate how to build a battery-powered temperature sensor and dashboard using the ESP32 microcontroller and C++/python programming.
Back in high school and early university days, I used to do beginner's robotics. We built a bunch of robots and participated in bunch of competitions. Actually, it was the first place I applied my programming knowledge to actually build something real. Over the recent years, I've been doing almost zero DIY electronics stuff and I was actually missing it.
Recently I wanted to monitor environment temperature, so I was looking online for some ready-to-use products. There are lots of good options, but I realized most sensors either don't sync data (they're offline), or they only work with a closed ecosystem like their own app or Apple Home. I thought why not building my own instead? I had recently gotten my Raspberry Pi as a birthday gift after all, and I could serve a Grafana dashboard on the Pi.
So I decided to give it a try by buying some basic electronic stuff (breadboard, wires, soldering iron etc.) and building my own electronics mini-workshop at home. That's where AliExpress came into my help: I've bootstrapped the project with low cost and with (reasonably) fast delivery.
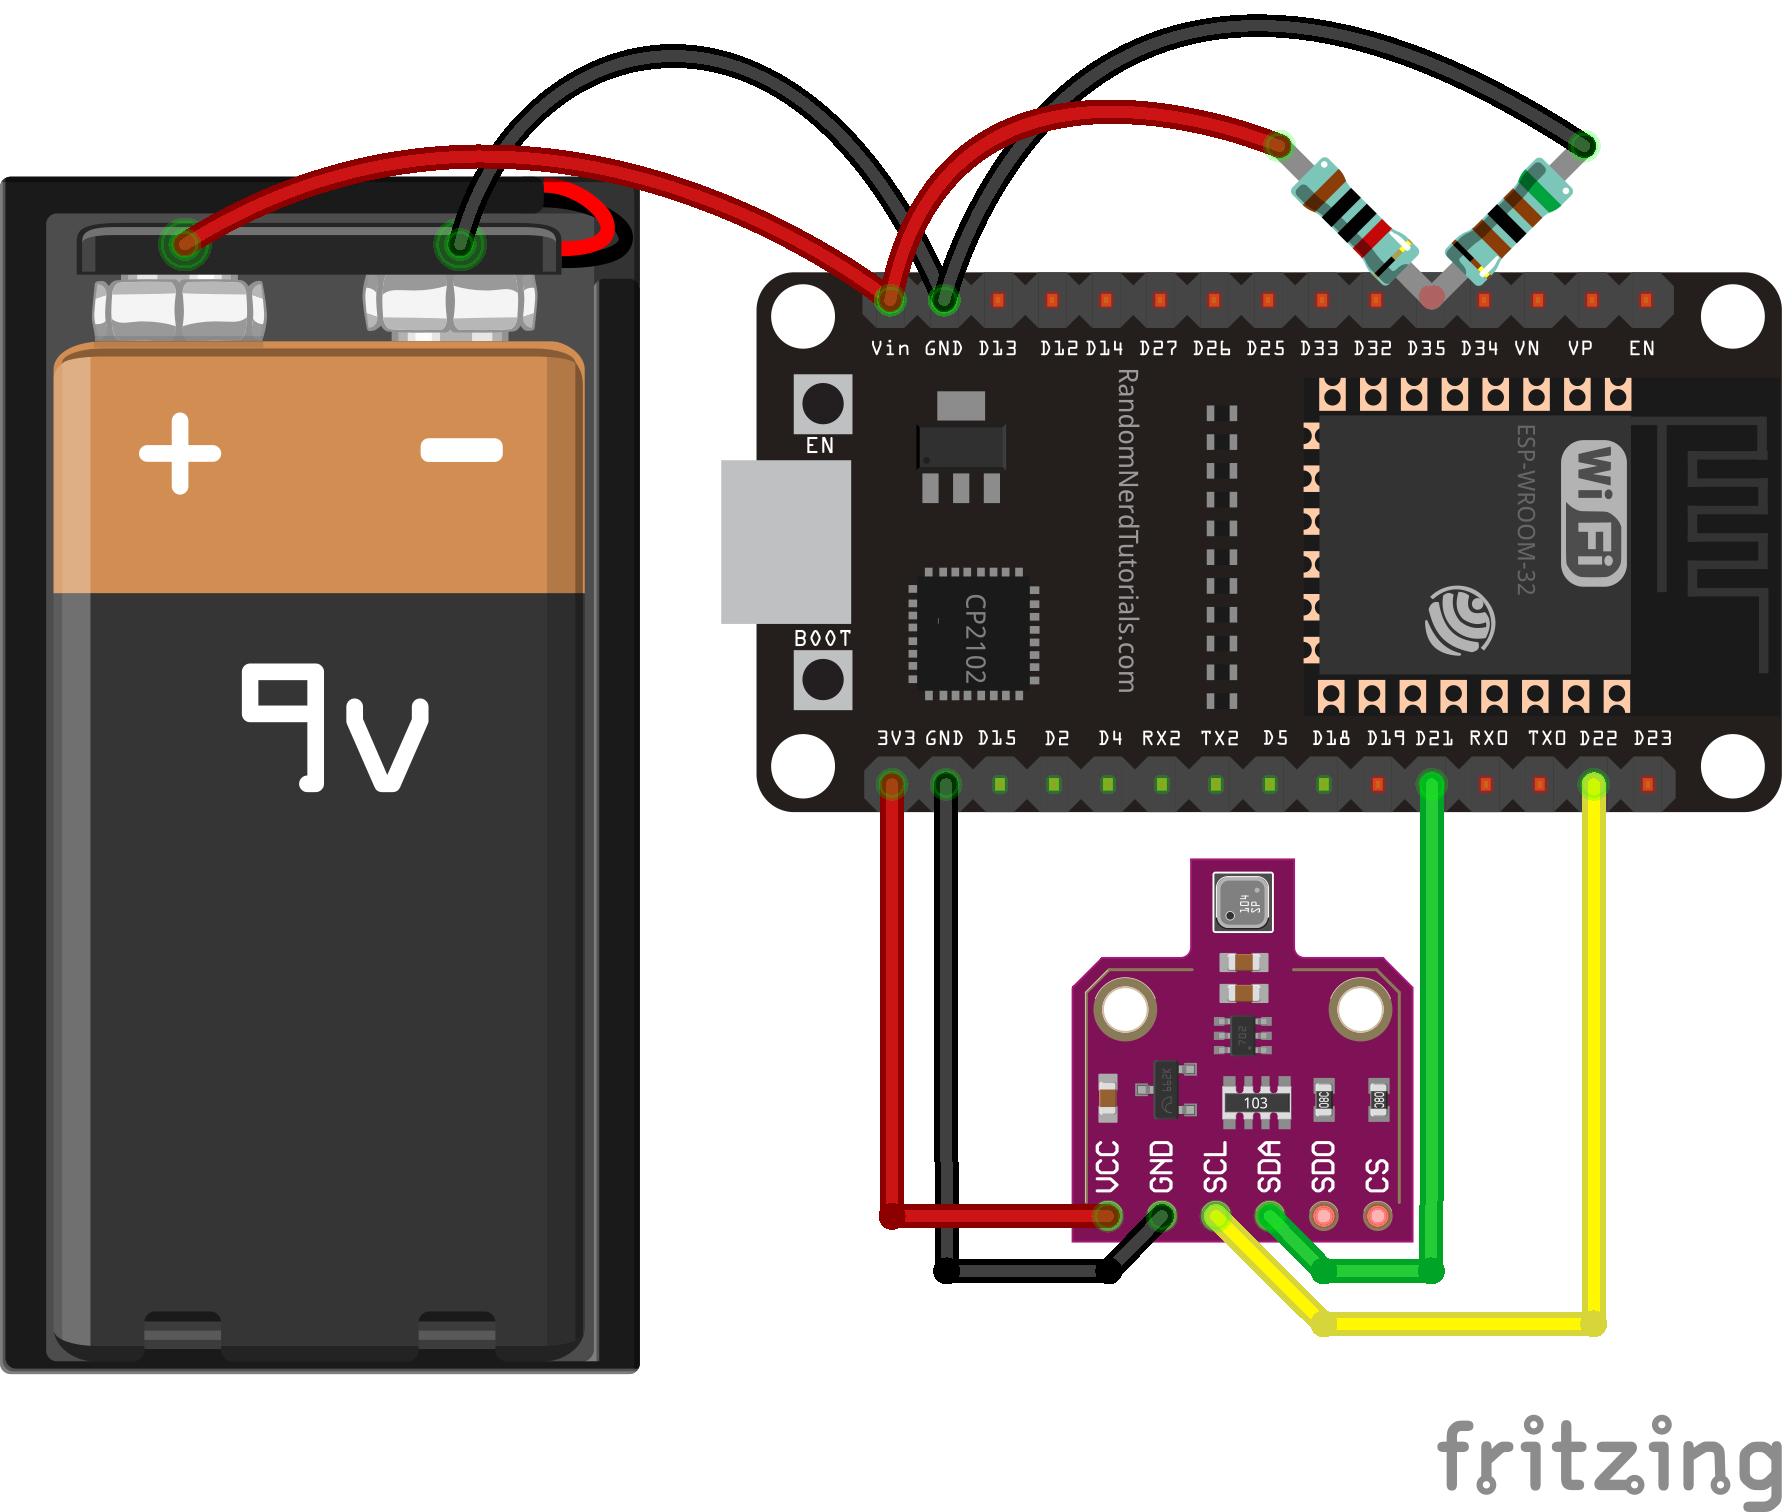
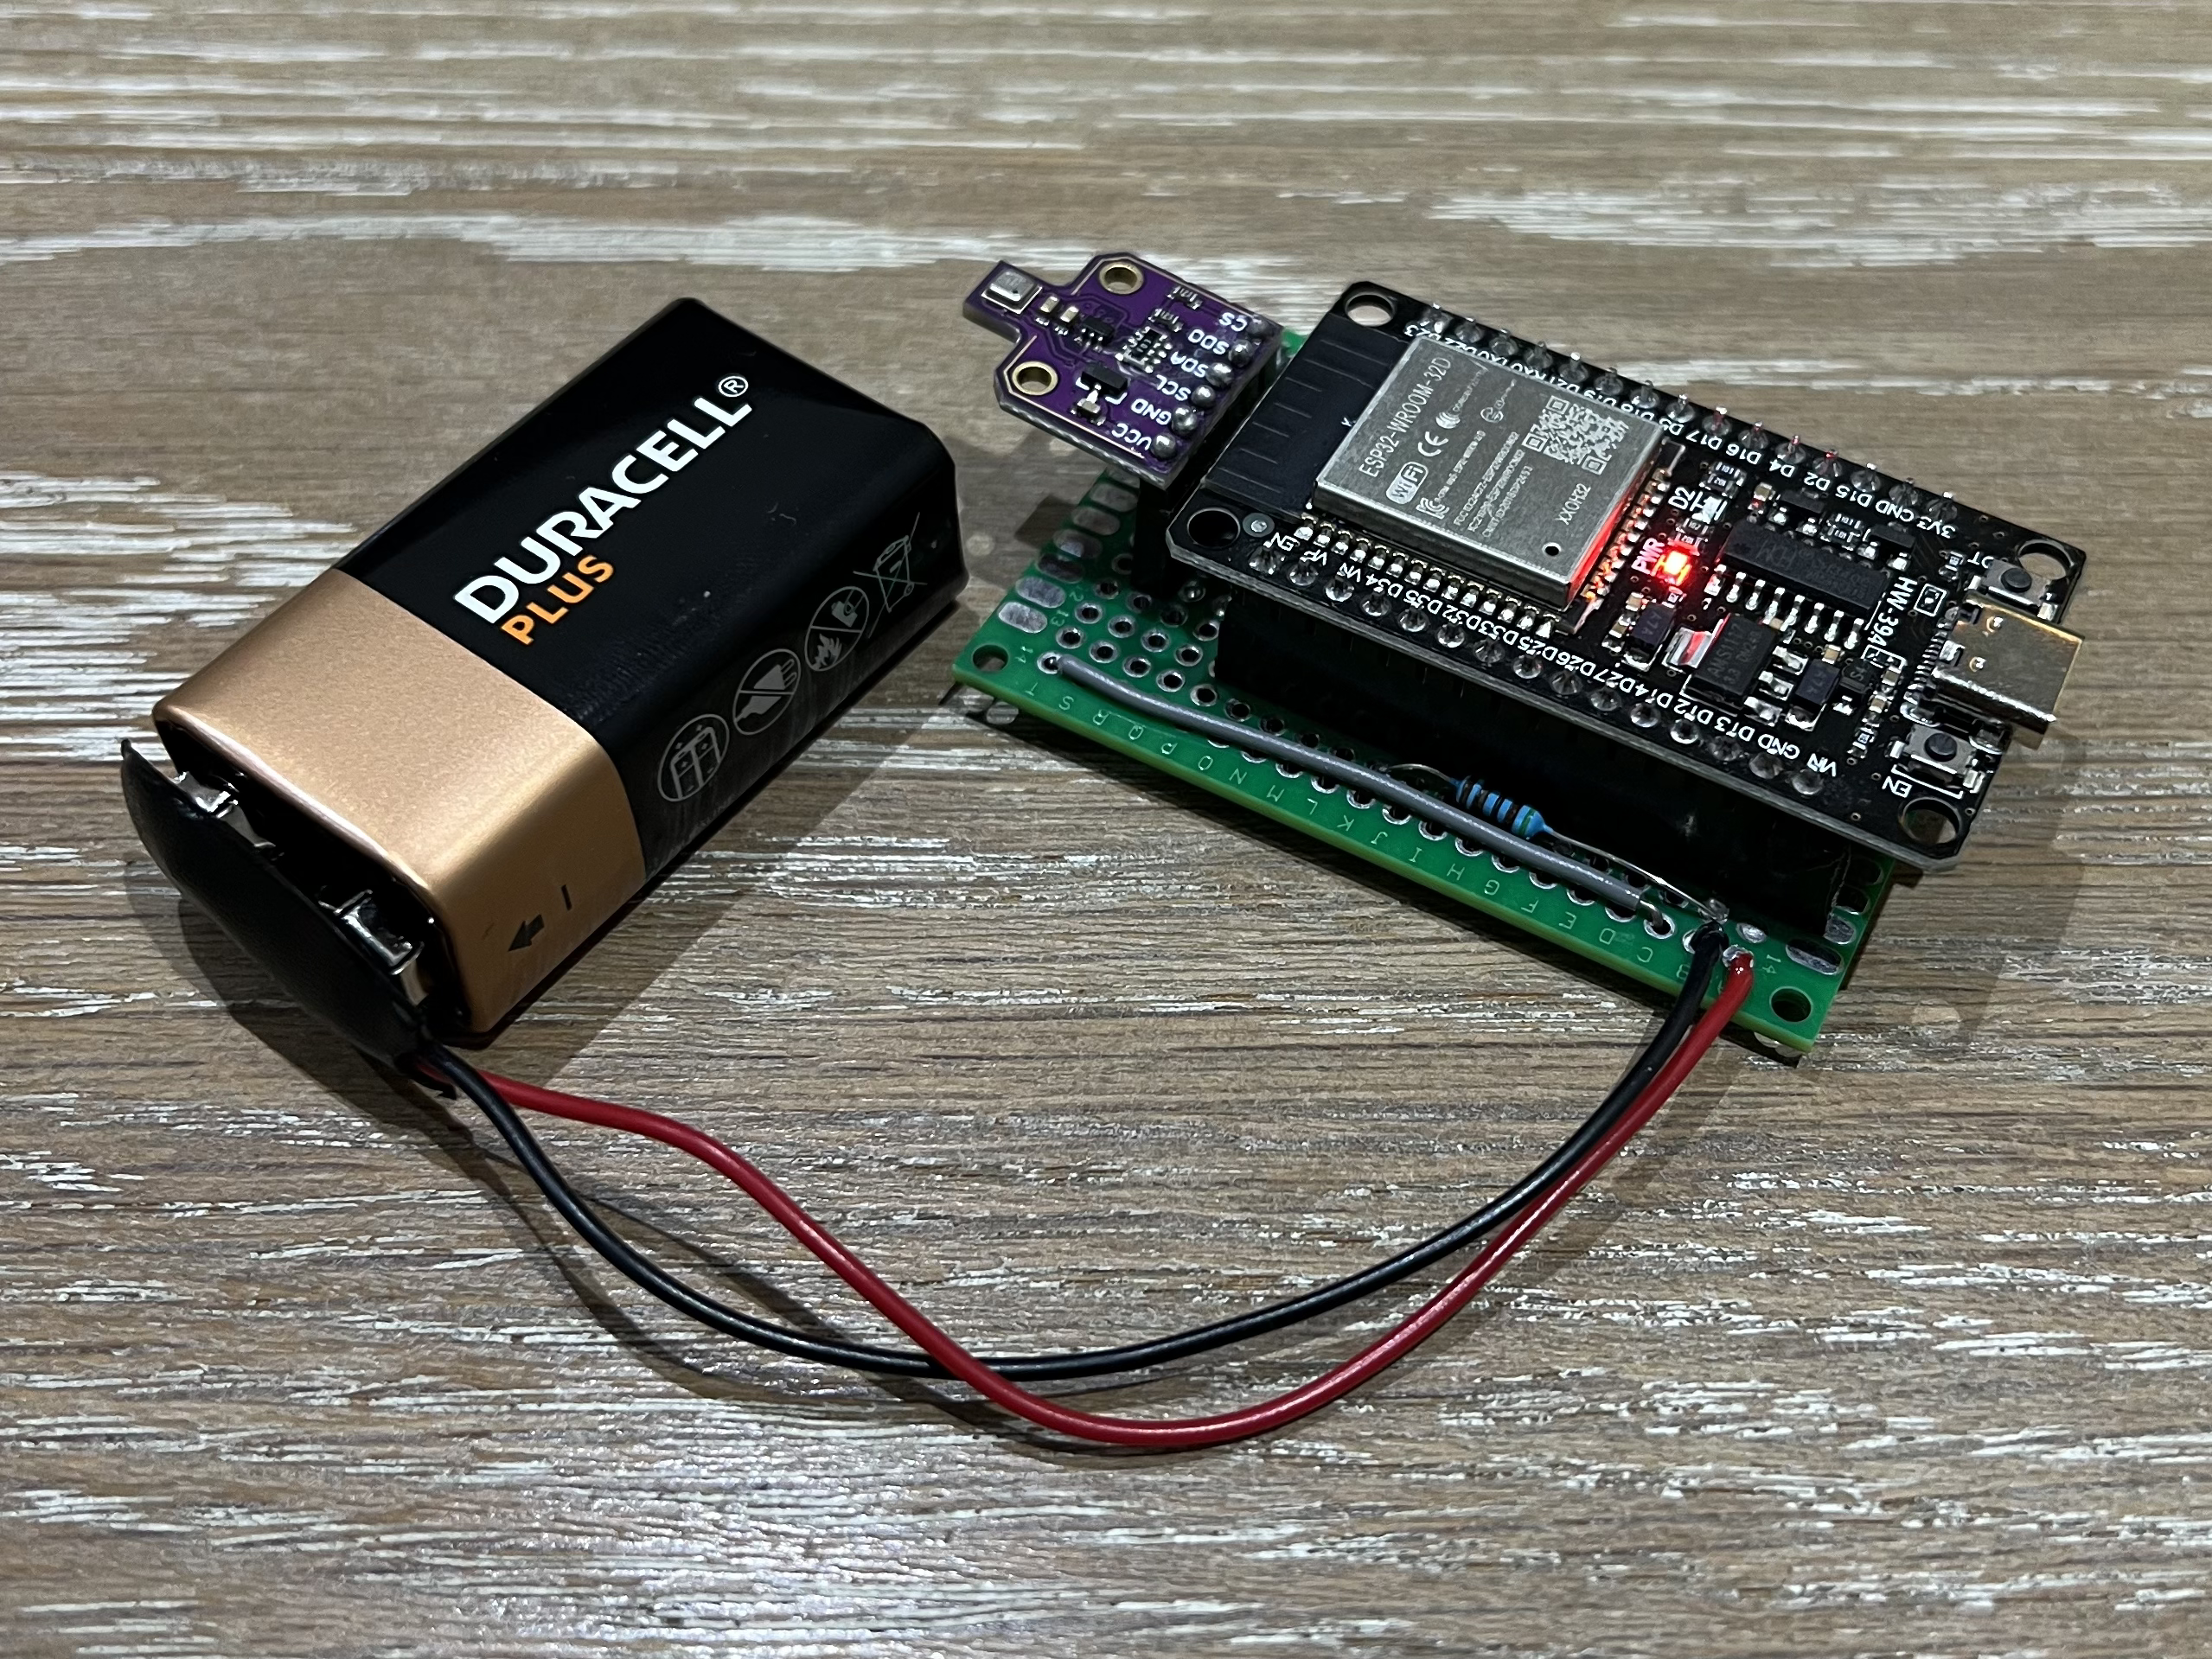
I've only had AVR experience. So either we had our ATMEGA32 and we programmed it directly, or we had some Arduino boards with the same micro-controller but a better IDE. I've heard about these amazing micro-controllers called ESP32 for IoT which is both super cheap (~€3) and super capable (WiFi, BT, 2x240MHz), and also with a huge ecosystem and tutorials behind it. So I decided to give it a try. I also used BME680 as my temperature sensor.
About the coding part, the goal is straightforward:
For developing on ESP32 family of boards, you have two main options:
esp-idf: The framework developed by Espressif, a bunch of modules, CLI tools & examples for developingFor this project, I decided to go ahead with Arduino IDE as it's easier for prototyping.
To keep it simple, I'm putting the code into two public GitHub Gists. There's one file of code for the microcontroller, and another one for the socket server and storing data on SQLite. The code is pretty simple, have a look if you're interested.
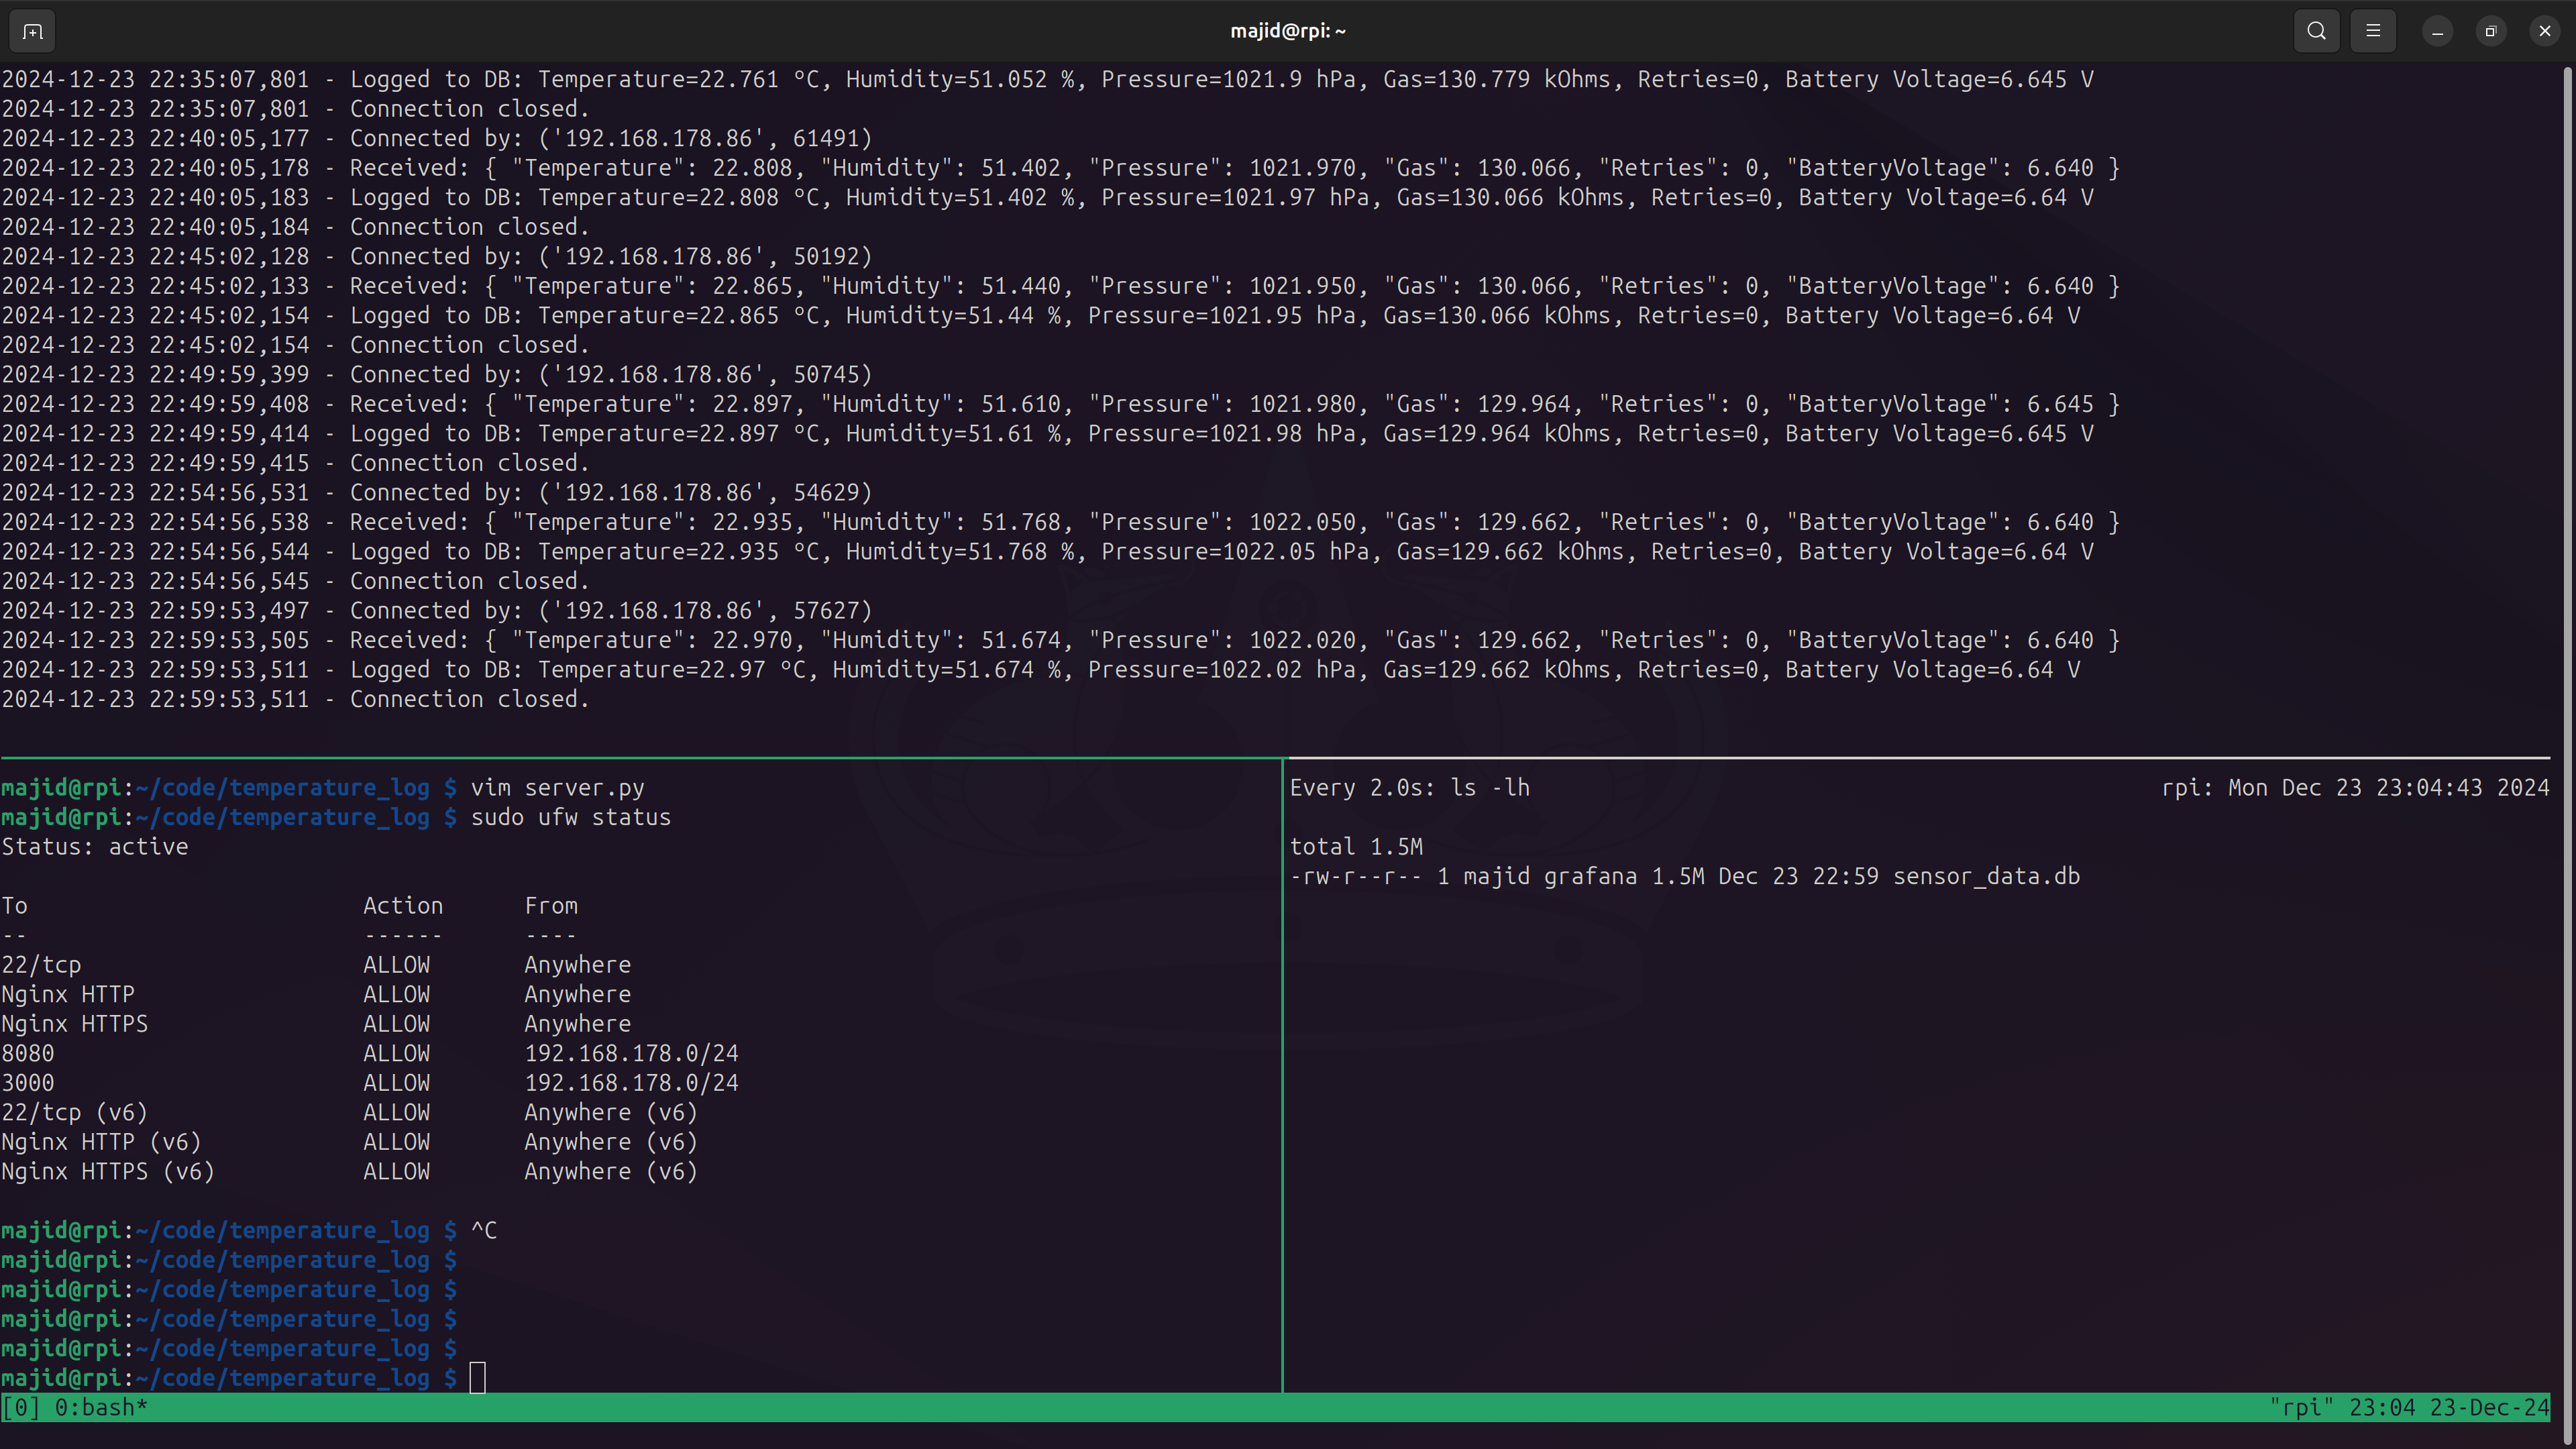
On my Raspberry Pi, I have socket a server to accumulate temperature logs. I read these logs from ESP32 and store them in a SQLite database. The only challenging part was to make it robust to network errors by adding timeouts and retries.
For serving my socket server, I simply use a tmux session. I love tmux and it's my go-to tool for doing stuff. Creating a systemd service might be a better alternative to the tmux session, but as tmux works pretty well I decided to think about replacing it later when I encountered any potential limitations.
tmux is an excellent tool, I've seen it first in Stanford's CS224n course materials of all places, and since then I fell in love with it.As I wanted to make my dashboard on Grafana, my natural choice for the database was Prometheus as there's a good integration between these two tools. Actually in a first version I was using Prometheus instead of SQLite. But there's something about Prometheus which made it unnecessarily complex for my use-case: Prometheus is pull-based-only by design.
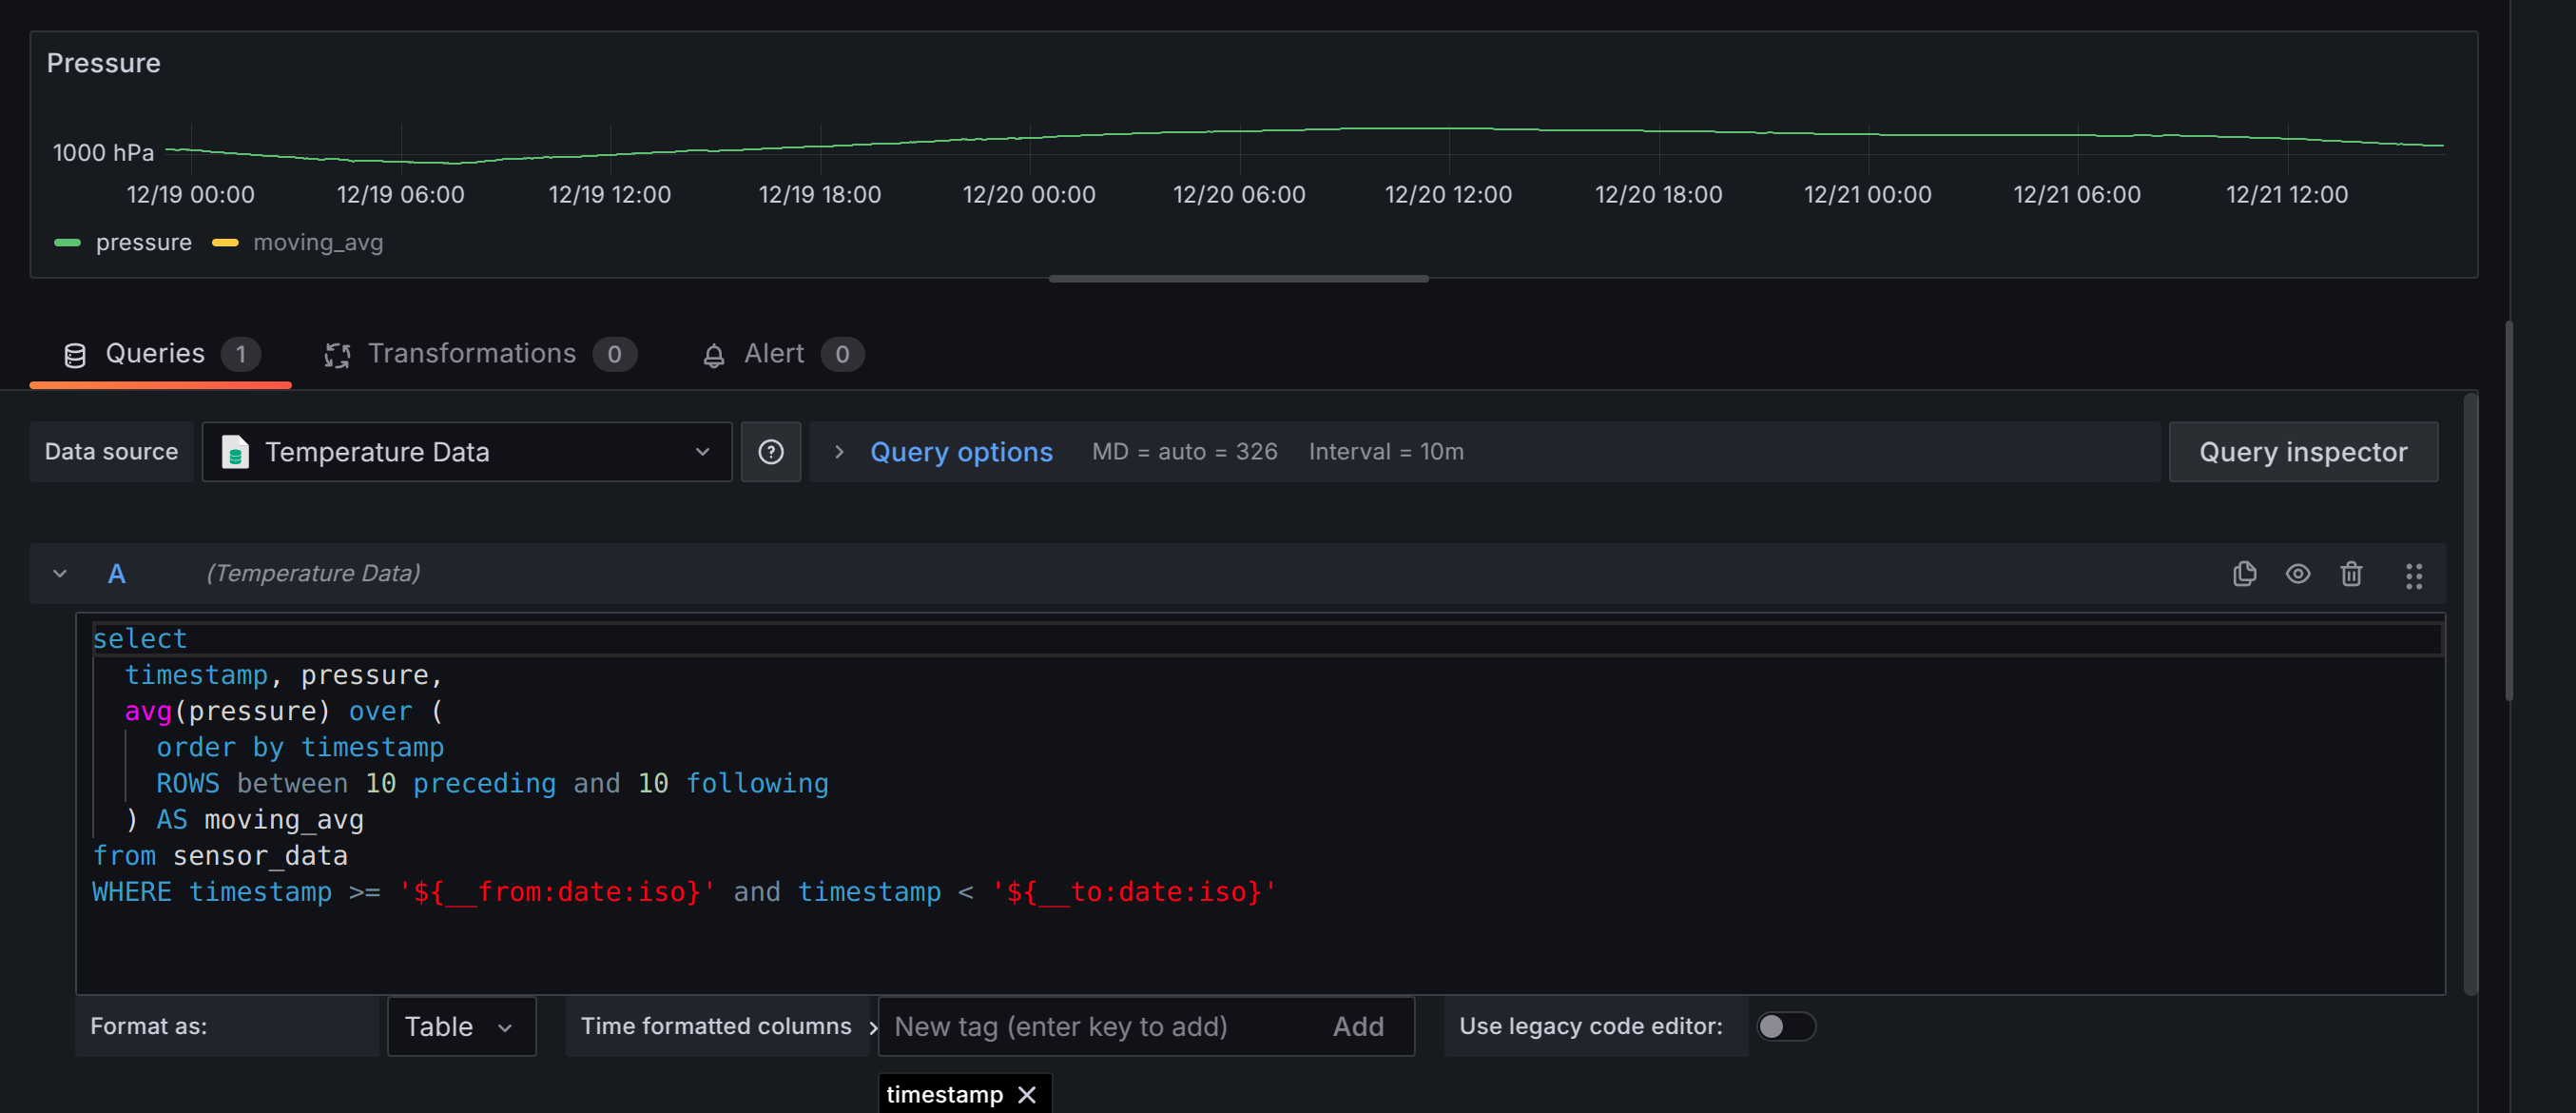
Being pull-based means Prometheus scrapes the metrics in an interval, and you'll need to maintain a Prometheus client in your application-side in a different thread. Also there was some complexities about missing data which wasn't easy to handle with Prometheus. And programming chart queries was easier for me in SQLite than PromQL. So I switched to SQLite for my database and the switch made everything simpler as I just push metrics to the DB.
Grafana is a popular open-source observability tool which is widely used. I've had prior experience with Grafana at work. So I selected it for my dashboard.
Installing Grafana was pretty straightforward on my Debian-based OS (Raspberry Pi OS). I just installed it via apt and enabled its service via systemctl and that was it.
But actually Grafana doesn't support SQLite out-of-the box. There's official support for popular databases like PostgreSQL and Prometheus, but for SQLite you'll need to rely a third-party add-ons. I used this one from Sergej Herbert.
It works pretty well, the only problem is it doesn't support annotations. I describe why annotations can be useful in the next section.
The sensor is running off a 9V battery, and I can put it anywhere within the WiFi range. It's pretty compact and easy to use. Actually I want to make at least one more of it to measure temperature in two rooms. Should be interesting!
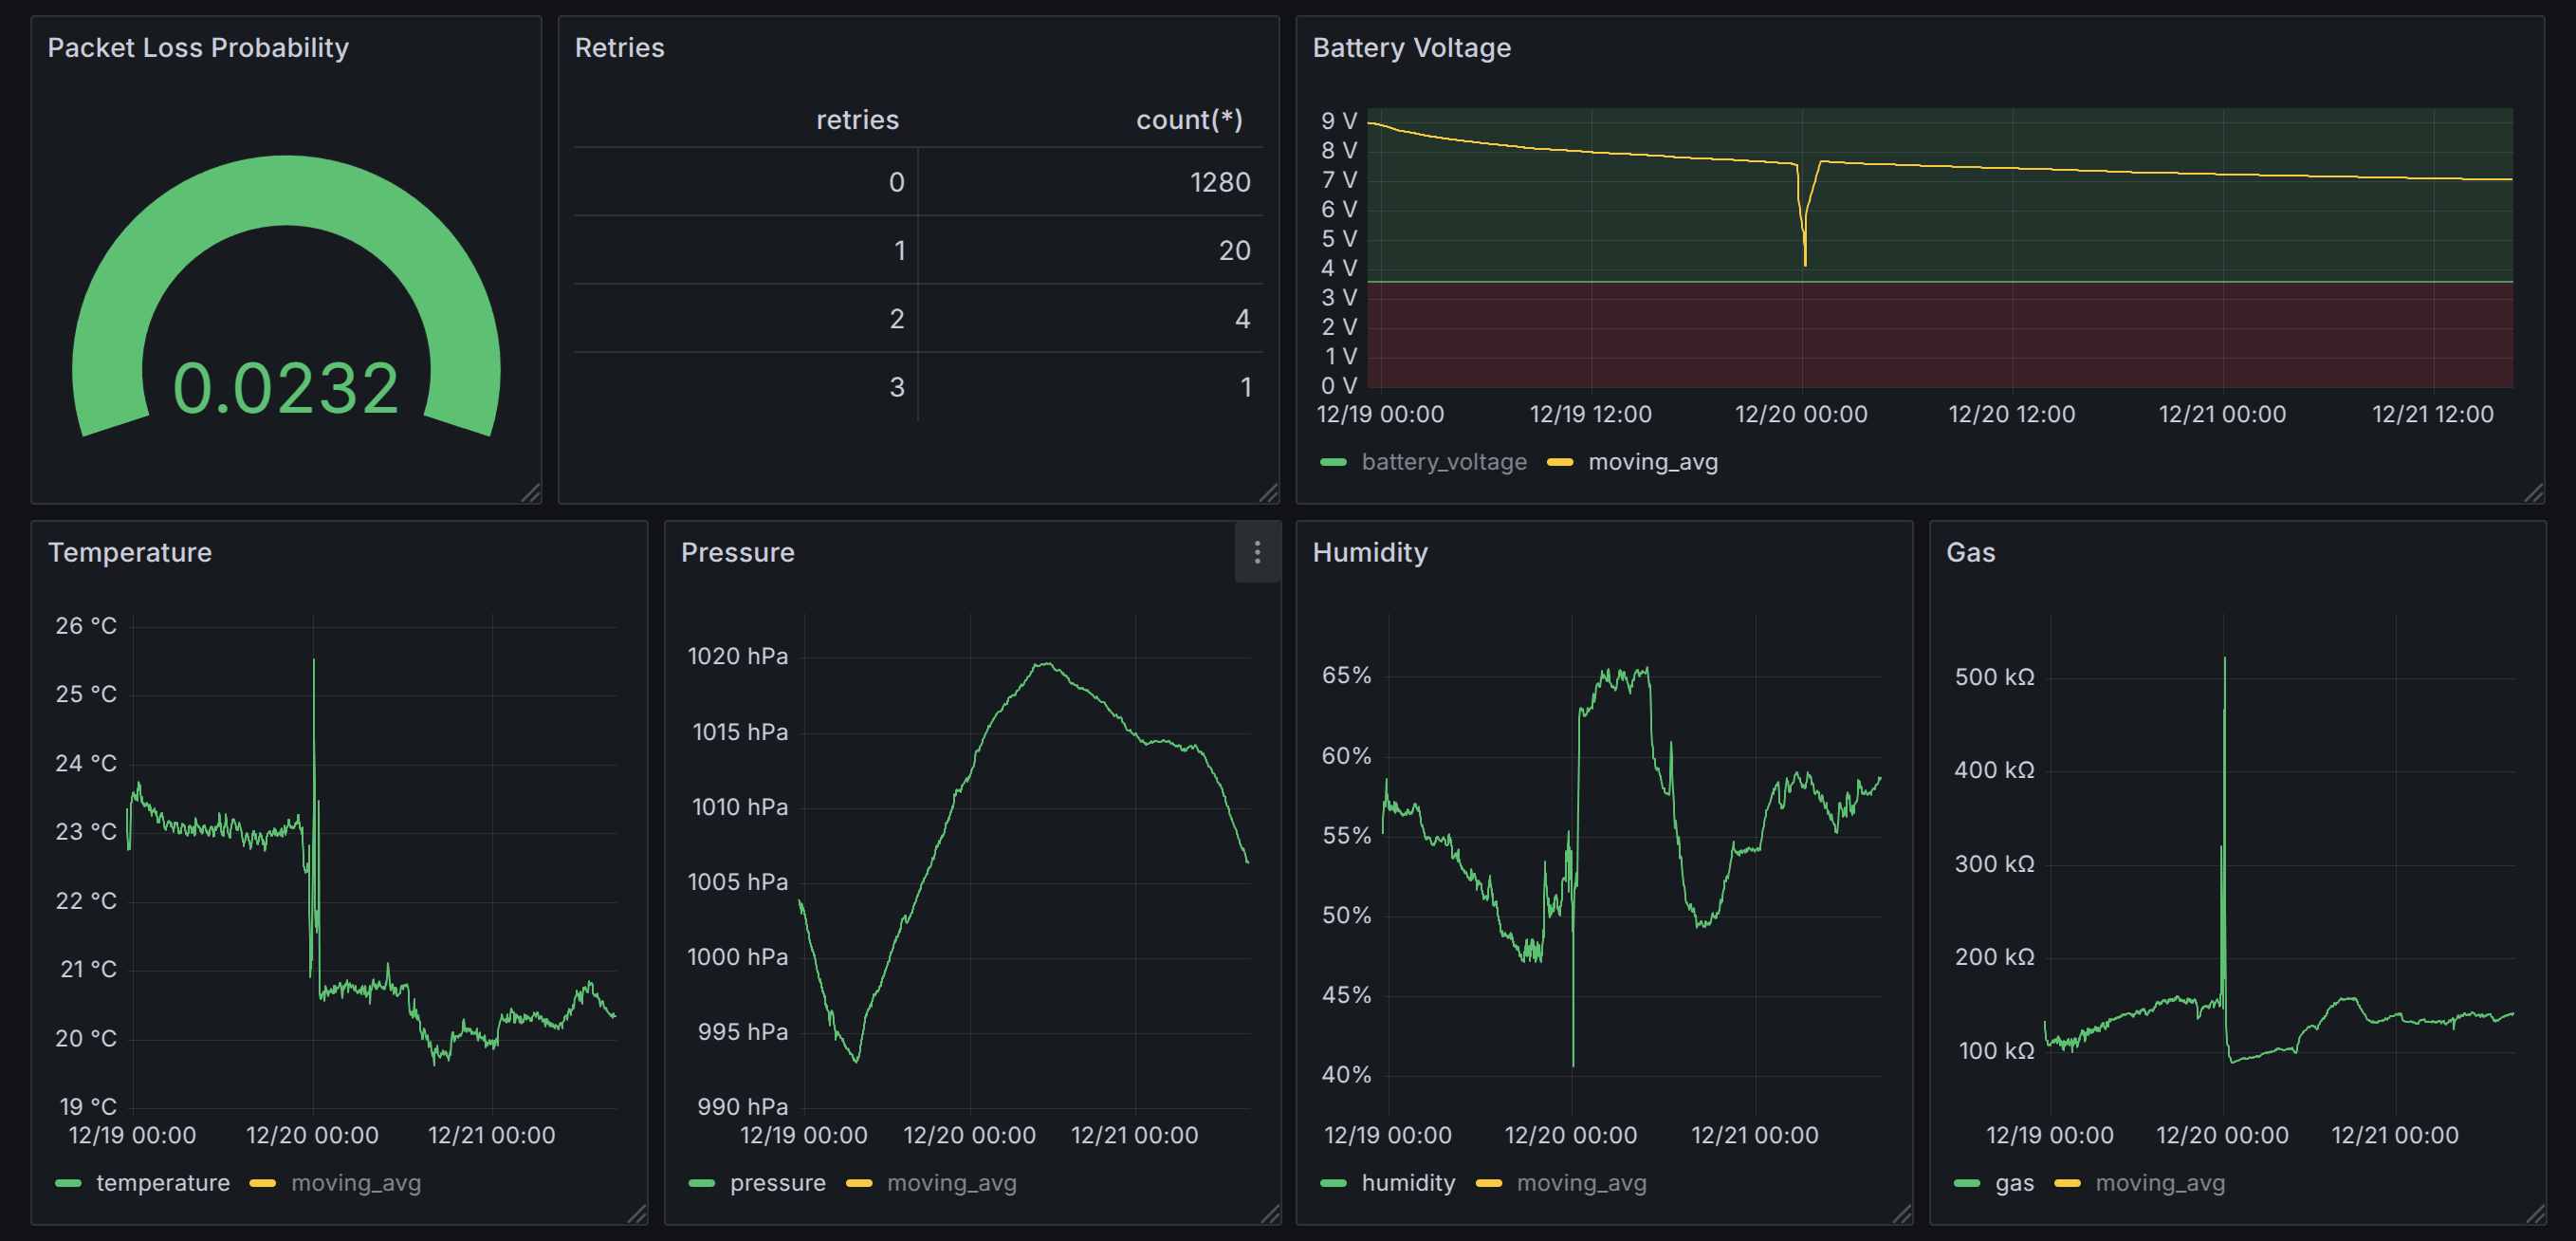
Also the dashboard looks pretty nice. I have both actual readings and the moving average for each chart, and also monitoring the packet loss and a bunch of other things.
I didn't want to expose this Grafana instance to public web yet, but my Firtz!Box modem has a built-in VPN support for accessing the local network in my house. So by connecting to this VPN I can access this dashboard from anywhere over the internet.
If you wanna do some DIY project similar to this, I'd suggest you to buy electronic stuff from AliExpress. AliExpress is probably quite cheaper than local electronic shop of your choice. Of course there's always a trade-off, so compare before buying.
Doing this project was quite fun and challenging, especially the parts about reliability and power consumption. But of course it's still far from perfect. So I have some (potential) next steps in my mind to make it even better:
WiFi is actually quite power-hungry. If you want to run this sensor off an outlet with an AC adapter, there's no problem. The problems start to arise when you want to run these things off batteries. There are several techniques for saving power and running off a battery (code optimizations, custom XTal, etc.), but the main thing is using an efficient protocol. Generally ESP32 family of boards support these 4 protocols:
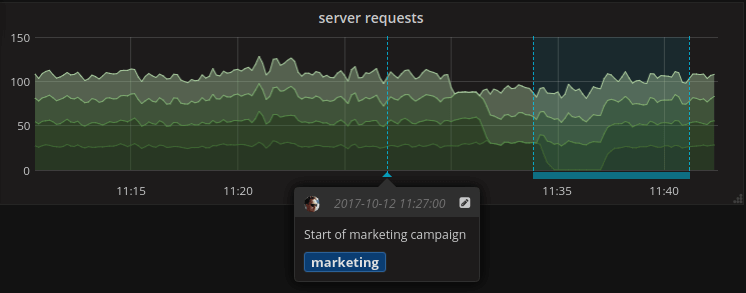
As I mentioned earlier, the SQLite plugin doesn't support annotations. Annotations in Grafana are a way to label timestamps/intervals and visualize them on the chart. So you can (programmatically) visualize on the chart how quick you'd lose the temperature after turning off the radiator, for instance.
At our place, we don't have a thermostat on our heating system installed, so heat management is quite challenging. A bunch of smart radiator actuators can be used alternatively. So I might get on in the future and try to integrate it with the current stack. There are unofficial API clients for smart actuators like this one for TP-link Tapo devices.
esp-idfAs I mentioned above, this esp-idf framework is the official framework for developing on ESP32 boards. Arduino IDE is actually less flexible than esp-idf. For example, you can use Bluetooth and the WiFi at the same time only with esp-idf. Also if you want to go ultra low power to be able to run you sensor off a button battery for months, you'll need to do some advanced customization stuff (this one, for example) which are only possible with esp-idf.
In this post, I described how to build a temperature sensor as a hobby project. For building this, only basic programming knowledge is required. So give it a try if you're interested. I hope you found this post interesting and useful!